Sidecar Health | 2022
Understanding Claims
Sidecar Health is a health insurance start-up that allows their members to be in the driving seat by giving them complete control of who they can see and how much they should pay. This project was focused on improving the claims detail page which is where users go to understand how Sidecar Health is processing and covering their medical expenses.
My Role
I was the lead designer on this project, working closely with the product manager and the engineering team. Focusing on making it clear how medical expenses are processed and covered by leveraging user findings from previous user research.

Part 1. Understanding the process
Pain Points
A claim is generated when a user pays for their doctor visit with the Sidecar Health VISA benefit card. Then the user retrieves their medical invoices from their doctor and uploads it to the claim for processing.
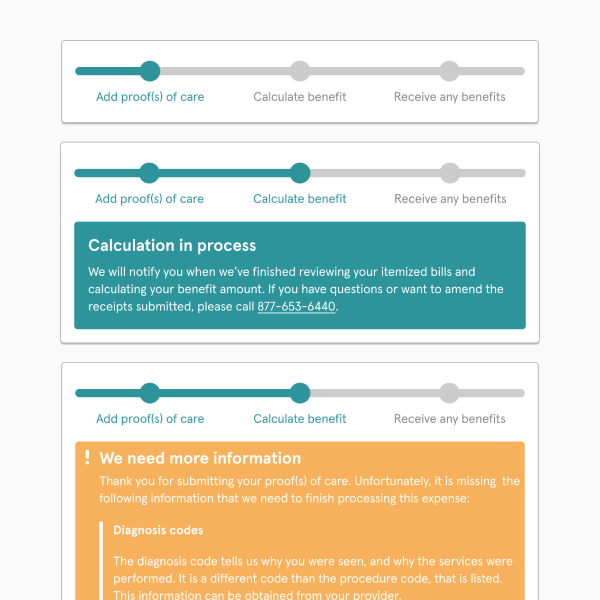
The progress bar on the within the claim details represent the status of their claim which is sometimes accompanied by alert bubbles with further descriptions. The progress bar displays three statuses while there are actually about nine in total. This kept users in the dark and missing important notices, especially when action is required.
Solution: Status Module
Removed the progress bar because the claims process wasn’t always linear. The new status module is designed to be concise to allow users to understand their claims at a glance.

Part 2. Understanding coverage
Pain Points
Once a claim is processed and all payments are settled, users view to claim detail page to understand how it was processed.
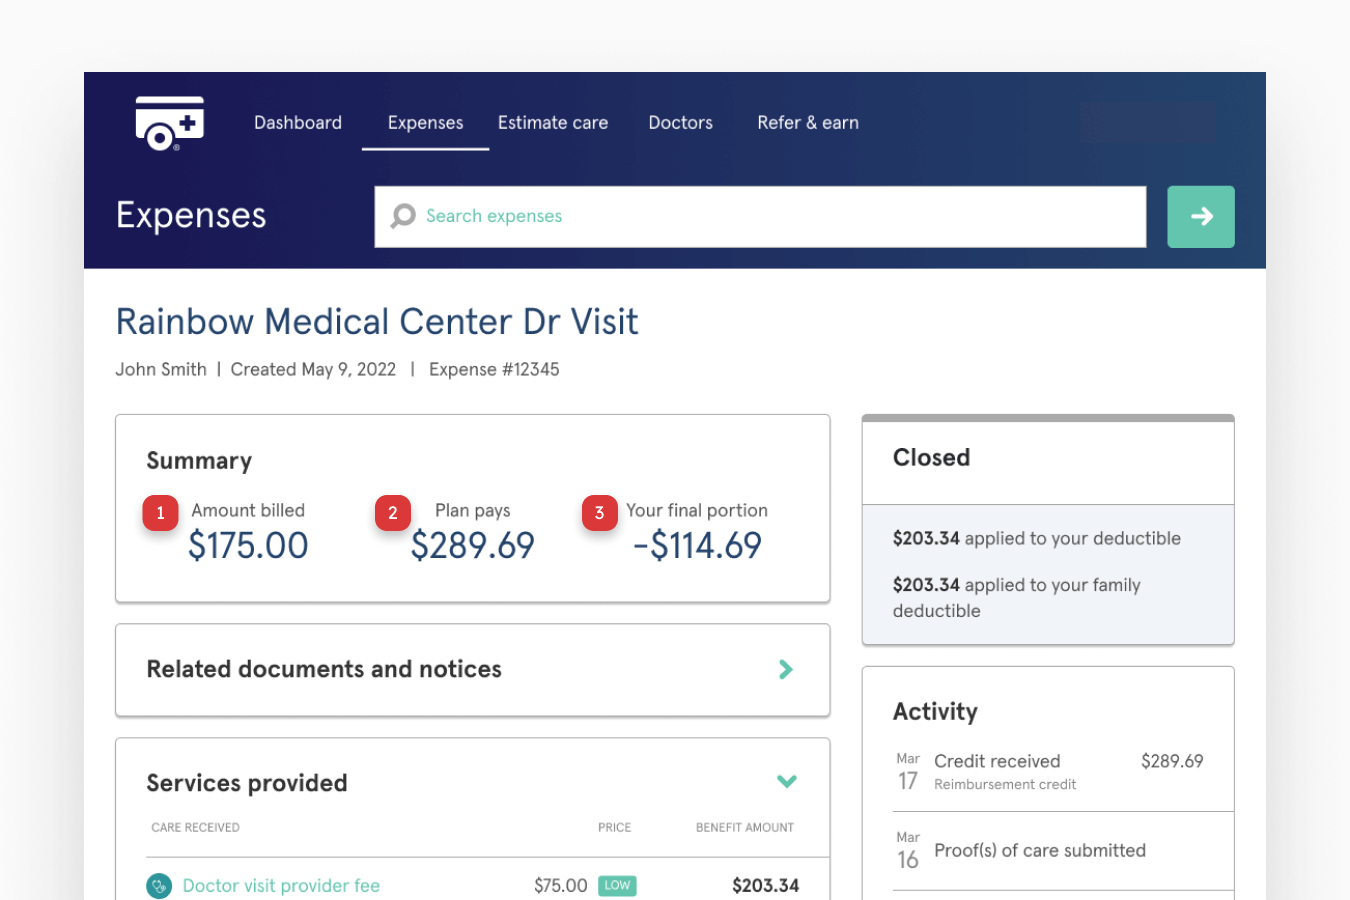
The original design highlighted three main data points which are (1) amount billed, (2) plan covered, and (3) member portion. However, the member portion didn’t always line up with the final amount that the users owed or received in credit, and seeing the three values left users confused on which value was important to them.
One final value
Narrow down the primary focus to one main value that users care about which is how much they owe or how much they’ve earned.
Detailed breakdown
Breakdown area that brings price transparency by displaying all the different data points that adds up to the final value.


